|
Real Time Visualization of Conditioned Signals
and Recorded Data |
 |
 Bar & Logarithmic Graphs
As an alternative to
displaying an individual channel waveform in a
window, you may choose to represent the digitized
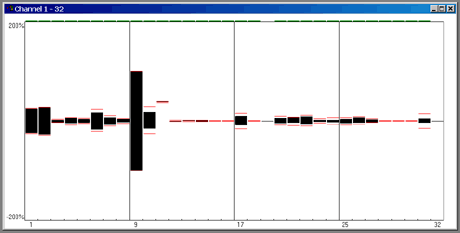
data in a real time linear or logarithmic bar
graph format. This type of display lets you easily
compare relative voltages between multiple channels.
In addition, each bar has two red Peak Hold lines,
which indicate the maximum and minimum voltages
that have occurred for that channel over all previous
sweeps, or since the Peak Hold lines were last
reset.

|
|
 Power Spectral Density (PSD) Displays
| Power Spectral Density
(PSD) displays provide a quick-look spectral
analysis
utilizing a Fast Fourier Transform (FFT). Analysis
results can be displayed utilizing either
linear
or logarithmic axes scaled from 0 to –100
dB. For both display types, the maximum x-axis
is automatically set to ½ of the current
sample rate (Nyquist frequency).

|
|
 Mutiple Channel Overlays
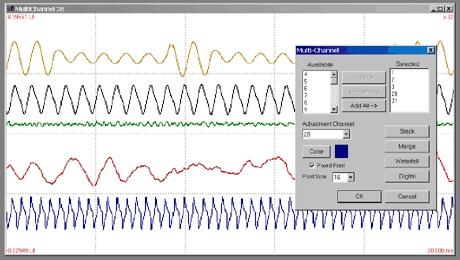
Any number of data channels and display
types can be merged onto a single display
window for
comparative viewing. In addition to automated
stacking, merge, and overlay options for time
domain graphics displays, digital measurements
may also be merged with either fixed or scalable
font sizing.

|
|
 Digital Multi-Meter
The Digital Multi-Meter
display option is a numeric readout for the
selected
channel including DC (mean), AC (rms), and AC
(p-p) voltage measurements. Either voltage
values
or
scaled engineering units may be selected.

|
|
 Time History Display
The Time History display
feature offers the ability to review a complete
recording
session in a single graphics window without the
time delays associated with large file access.
During the acquisition process, the software
creates a compressed “history file” representing
the entire recorded signal in a condensed
format.
This reduced file can then be accessed quickly
for an overview of signal activity, inclusive
of
any event markers, with rapid access to expanded
display windows.

|
|
 Dual Cursors for Data Analysis and Export to Excel
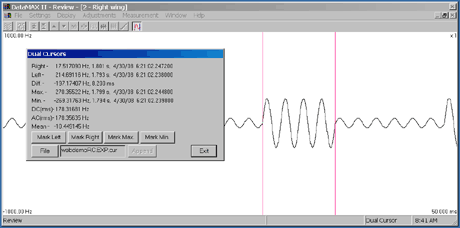
Dual Cursors are available
to control measurement functions in both
the
Waveform Display and Power Spectral Density
windows. When Dual Cursors are selected,
the
current window is automatically enlarged to
the maximum size to allow detailed viewing
and
placement of cursors. At any time, a single
click can be used to export measurement
values to
a spreadsheet for further analysis.

|
|
 Data Export with IRIG Sync Option
Export utilities allow
you to save any selected portion of a recorded
data file in Binary, ASCII or other common data
formats. Individual channels may be selectively
included or excluded from the exported data file.
Additional capabilities include data decimation
with matched low pass filtering to prevent aliasing,
and the ability to time sync data to any recorded
IRIG B channel.

|
|
 Save and Load Custom Displays
Multiple user-defined
display configurations can be stored for quick
access from a drop down menu.

|
|
